The Social Media tool has undergone several advantageous updates. These will provide stable and efficient analysis. Check them out!
First of all, meet the new ‘Facebook’ section. It contains three new reports: ‘Engagement’, ‘Audience’, and ‘Activity’. Most of the data from these reports has already been available before. However, the old reporting structure wasn’t convenient enough, since different social channels provide different types of data, and sometimes it’s really difficult to get a good representation of all social channels using only one report. That's why we’ve decided to move toward new stand-alone sections.
‘Engagement’ report
Let’s take a look at the ‘Engagement’ report. It consists of 4 main sections.
The top section consisting of 4 metrics provides a quick view on engagement level and its change.
The second section – ‘Engagement summary’ shows you if there's a prevailing engagement type and to signal if there's a high engagement peak on some day. This section includes a table with likes, shares and comments distribution.
The ‘Engagement trend compared to competitors’ section allows you to quickly identify your competitors’ high-engagement peaks. Hovering over a peak and clicking on it will show the content users are engaging with. This is very useful for finding the most engaging content that your competitors’ have posted, and studying it.
The ‘Total engagement compared to competitors’ section allows you to compare all your competitors’ total engagement, as well as their likes, shares, and comments – very convenient for checking who's ahead.
‘Audience’ report
The ‘Audience’ report shows overall data about Facebook page likes at the top section.
The ‘Page likes trend’ chart is to show the number of total Facebook page likes changed over the selected time period. Changes in both activity and engagement can be mapped on audience trend.
The ‘Where are this page’s fans from’ chart, as the name suggests, shows how the fans of this Facebook page are distributed by countries.
The last two comparative charts allow users to compare their audience with their rivals.
‘Activity’ report
The top section of the ‘Activity’ report contains overall data on posts published by a particular company.
The next three charts deal with your published posts performance and users’ engagement with content.
More Social Media tool updates are ahead. Stay tuned and don’t forget to send us your comments and suggestions at smm-tool-feedback@semrush.com.
Website analytics platform Crazy Egg is now available to use in the Semrush App Center, providing marketers with in-depth visitor insights to help optimize their websites.
Product News
August 11, 2026
Introducing Adobe Brand Visibility: A Unified Solution for the AI Search Era
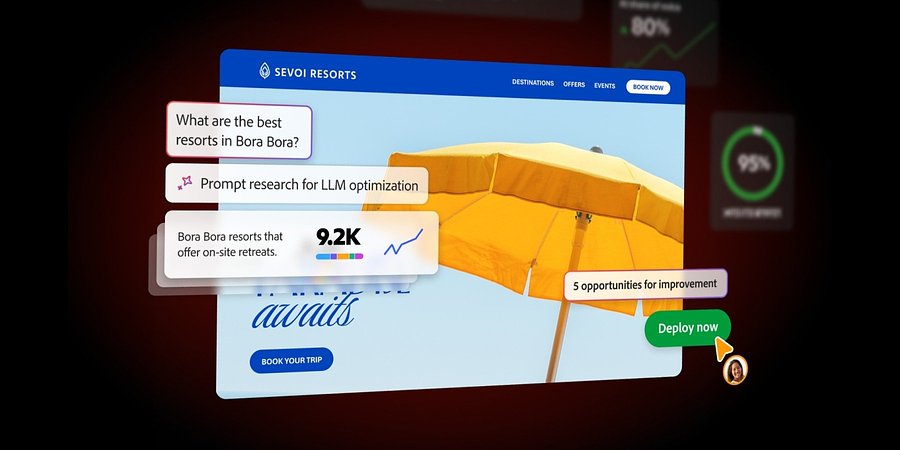
Adobe Brand Visibility is the first unified solution that brings together Semrush’s AI visibility intelligence with Adobe’s agentic content optimization capabilities, grounded in a deep understanding of business and brand context for organizations to enhance their presen...
Product News
June 17, 2026
Semrush’s New Traffic Insights Explains Changes In Competitor Traffic Performance
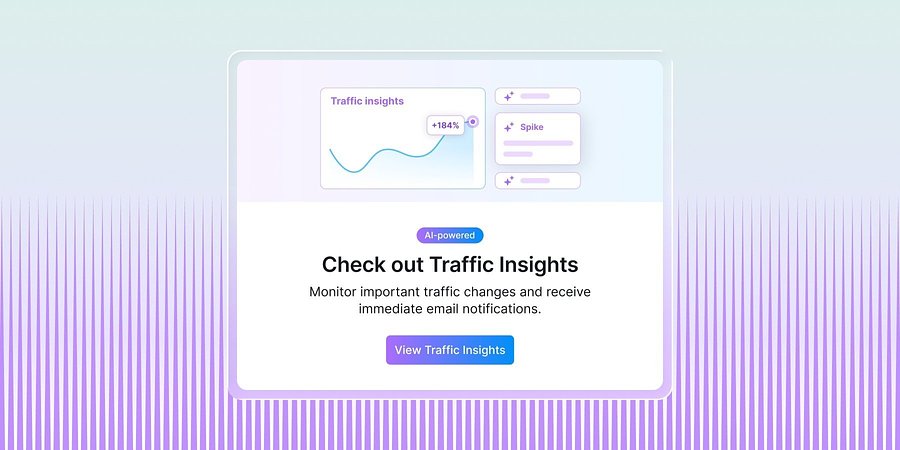
New AI-powered Traffic Insights in Traffic Analytics help teams identify competitor traffic spikes and drops, understand the drivers, and act faster.